Introduction
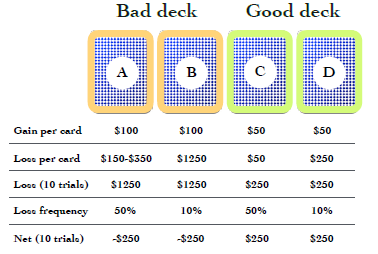
The Iowa Gambling task [Bechara et al., 1994] assess real-life decision making. Developed by researchers at the University of Iowa, subjects participate in a simulated card game. Participants start with $2,000 and are presented with four card decks (A - D), with each deck more likely to yield monetary rewards or penalties over time i.e. some decks are “bad” while others are “good”. Below, A and B are considered “bad” as they have a negative expected value, while C and D are considered “good” as they are associated with a positive expected value. Test-takers obtain feedback on the amount lost or gained and the running total after each choice (trail). The subject’s goal is to adapt their pattern of choices to maximize the reward received.
In standard setups, the task typically lasts 100 trials. Empirical Investigations have shown that healthy (neurotypical) test-takers generally become aware of the “good” and “bad” decks after 20 to 40 trials [Weller et al., 2010]. However, patients who suffer from orbitofrontal cortex (OFC) dysfunction tend to continue choosing bad decks even though the realization of continued monetary loss may have already occurred in these participants. As presented above, participants must choose advantageous long-term choices over favourable short-term picks to achieve the greatest end monetary gain. Therefore, IGT remains a popular choice to evaluate decision making and, by extension, impulsivity as it does not suffer from the self-reflection biases that questionnaires tend to display.
Description of Datasets
This investigation utilizes a dataset from a “many labs” initiative on the Iowa Gambling task, grouping ten studies and containing data from 617 healthy participants [Steingroever et al., 2015]. The data consist of the choices of each participant on each trial and the resulting rewards and losses.
Note
Not all studies had the same number of trials. The number of trails varied from 95, 100 and 150.
The table below summarizes the multiple datasets used in this investigation.
Labs |
Number of Participants |
Trails |
|---|---|---|
Fridberg et al. [2010] |
15 |
95 |
Horstmann et al. [2012] |
162 |
100 |
Kjome et al. [2010] |
19 |
100 |
Maia and McClelland [2004] |
40 |
100 |
Premkumar et al. [2008] |
25 |
100 |
Steingroever et al. [2011] |
70 |
100 |
Steingroever et al. [2011] |
57 |
150 |
Wetzels et al. [2010] |
41 |
150 |
Wood et al. [2005] |
153 |
100 |
Worthy et al. [2013] |
35 |
100 |
For further clarification of the different IGT versions used, please consult this paper. In addition, an explanation of these datasets is provided in the Initial Data Exploration Section.
In this investigation, we seek to use the K-means clustering approach to segment the participants into well-defined groups. To start, we perform an initial data exploration to perform transformations & data sanitization checks; acquire rudimentary statistics of the datasets; perform data augmentation; create exploratory visualizations. Next, we perform cluster analysis and evaluate our clusters using metrics such as Silhouette Coefficient and an Elbow curve. These clusters represent participants that exhibit similar decision-making patterns and may have similar underlying psychological qualities such as impulsivity, stress reaction level to punishments or similar learnt experiences. Next, we attempt to form a federated k-means algorithm to preserve the privacy of the individual labs. Finally, we conclude with the most important outcomes of our work.